Procedures
Define test scripts, track versions, and analyze performance metrics. Monitor yield, pass rate, and cycle time across procedures in TofuPilot.
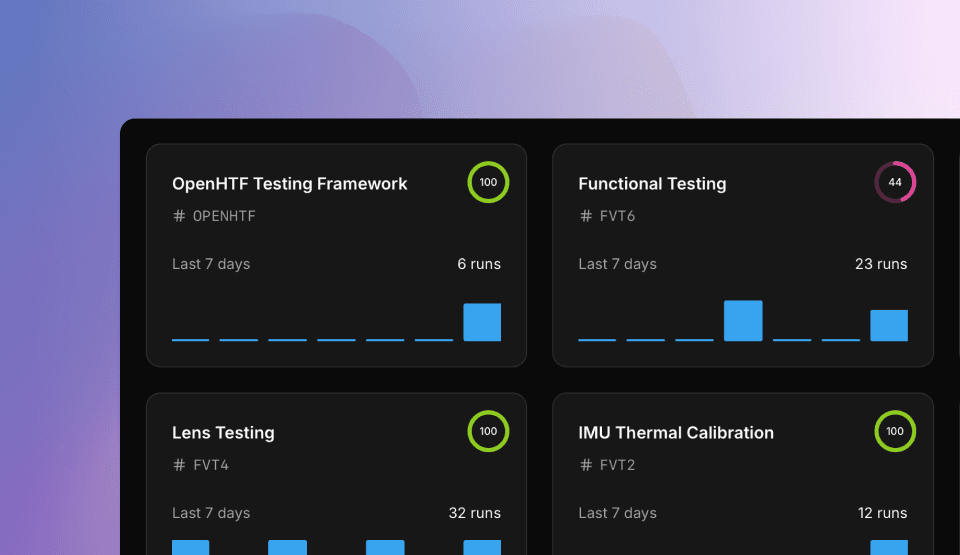
Overview
A Procedure represents your test script and links it to analytics, yield tracking, and production stations. It aggregates results from multiple runs to provide insights into test performance and quality trends.
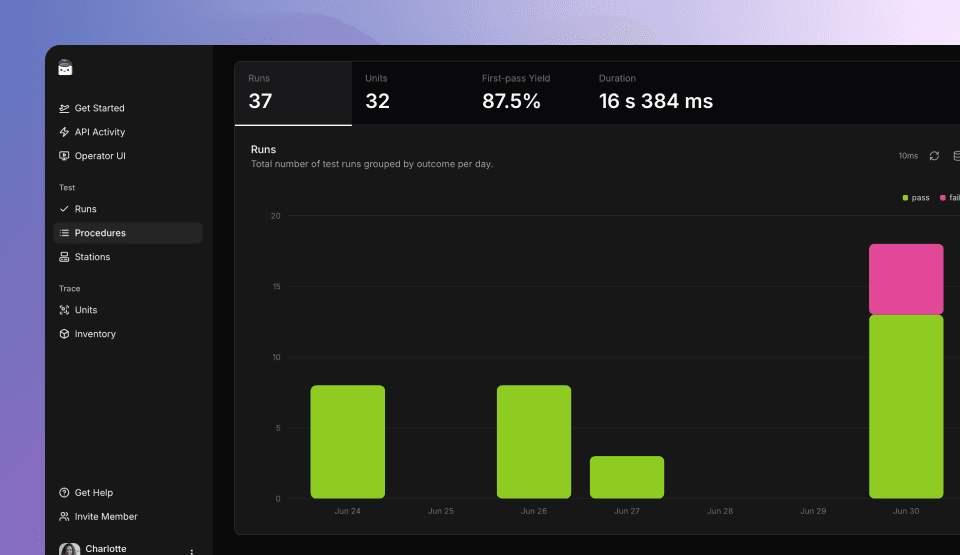
Analyze Runs
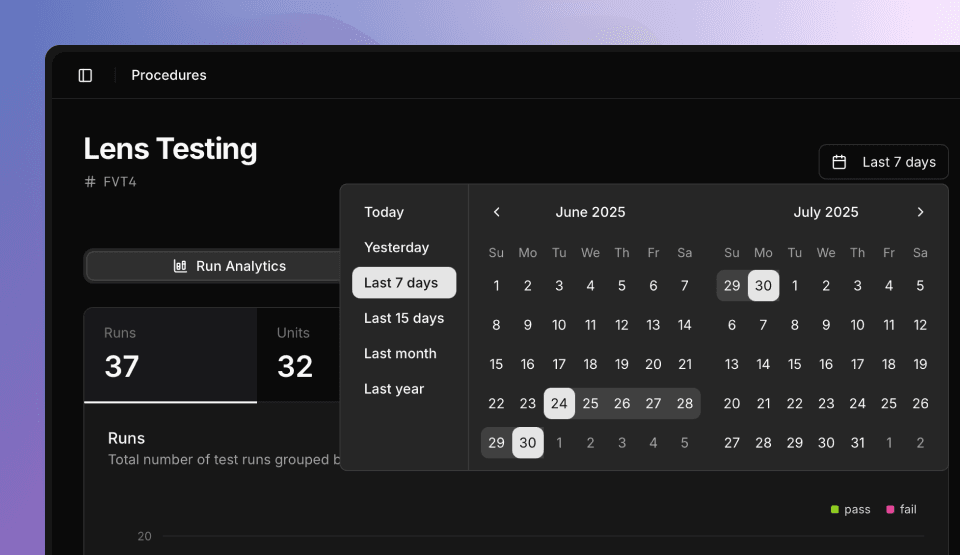
View test performance metrics and trends in the Run Analytics tab. Track daily patterns, failure rates, and timing data across all your test executions.
Runs
Daily test volume grouped by pass/fail outcomes. Identify failure spikes and testing trends over time.
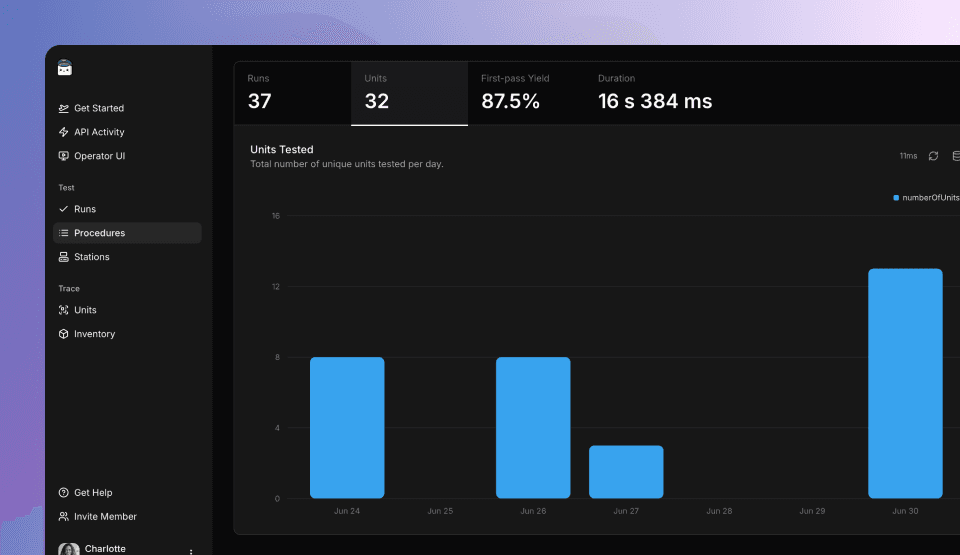
Units
Unique units tested daily based on serial numbers. Runs typically exceed units when devices are retested.
Yields
Pass rates by attempt number, grouped daily to track performance trends:
- First-Pass Yield (FPY): Percentage passing on first attempt
- Second-Pass Yield (SPY): Percentage passing on second attempt
- Third-Pass Yield (TPY): Percentage passing on third attempt
- Last-Pass Yield (LPY): Percentage eventually passing (useful for scrap rate estimation)
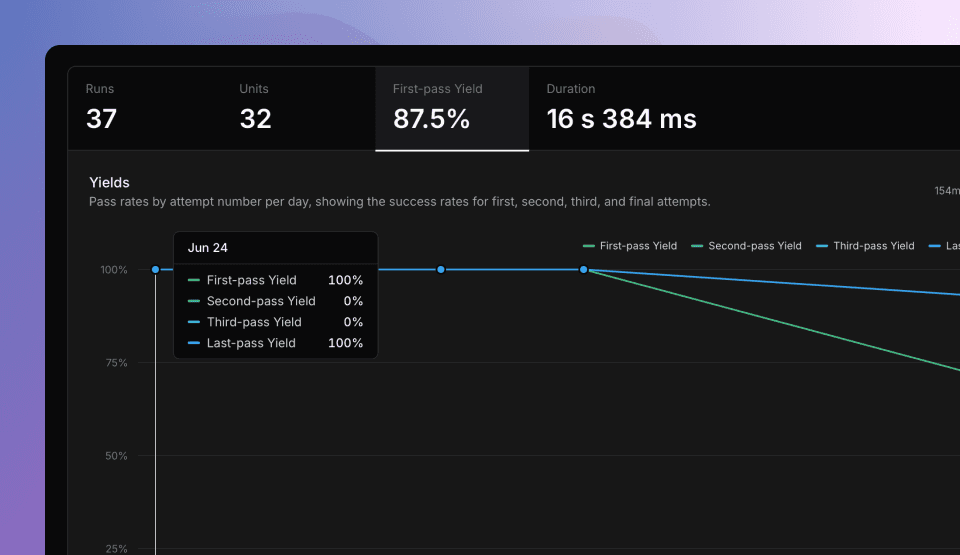
FPY is also known as throughput yield (TPY) in some manufacturing contexts.
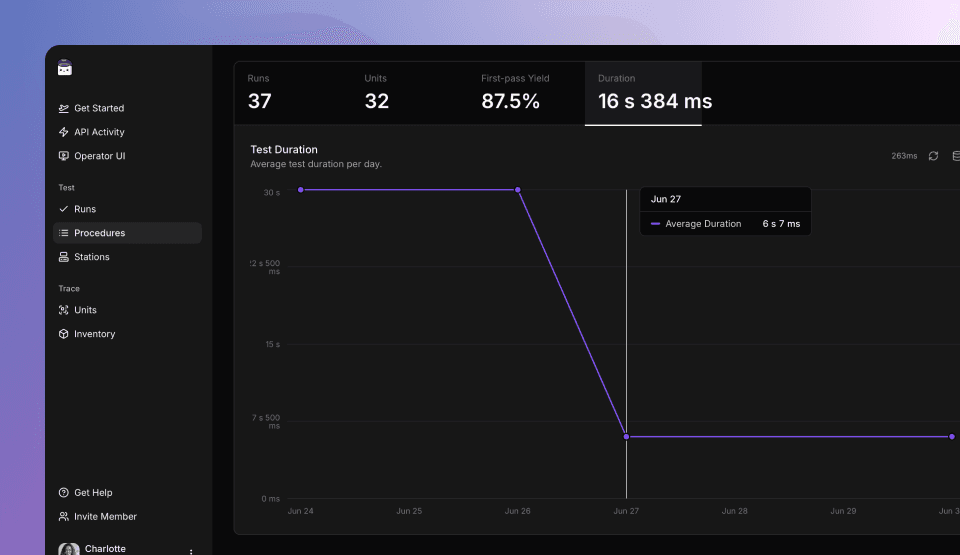
Run Durations
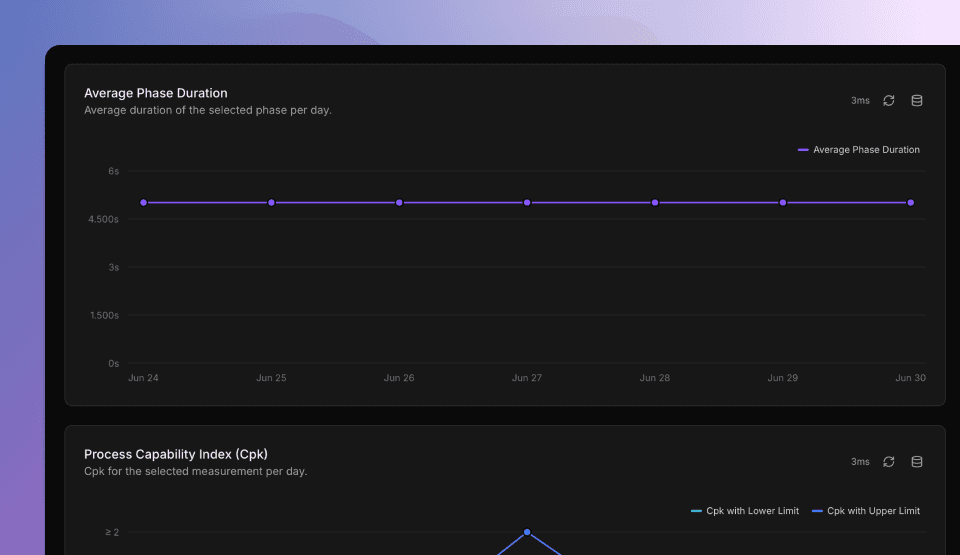
Average test duration per day. Detect performance regressions or timing changes in your test process. For individual phase timing, see Phases Insights.
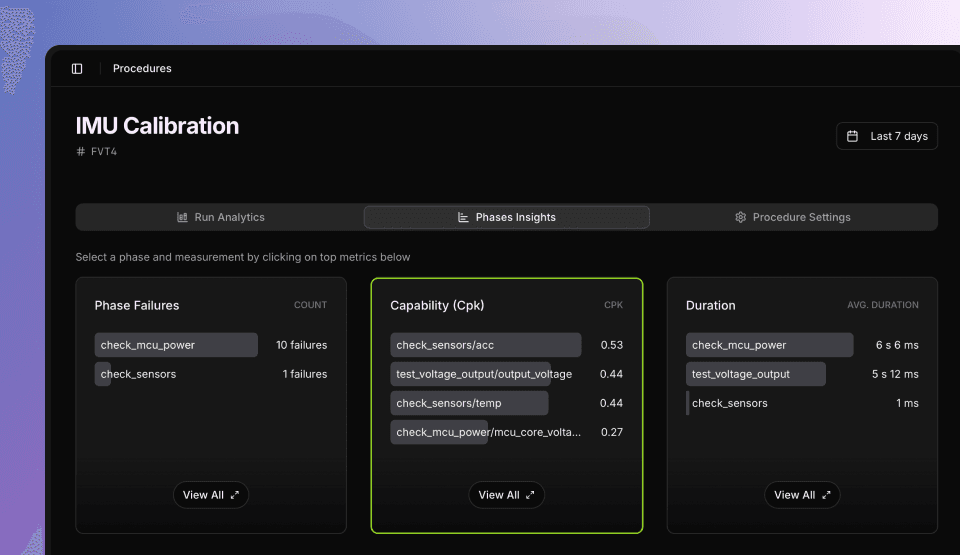
Get Phases Insights
Analyze test issues at the Phase level: connection errors, unstable measurements, and timing problems. TofuPilot tracks each Phase individually to pinpoint issues and improve Procedures. Monitor performance over time, identify bottlenecks, and detect instability using Process Capability Index (Cpk) and control charts.
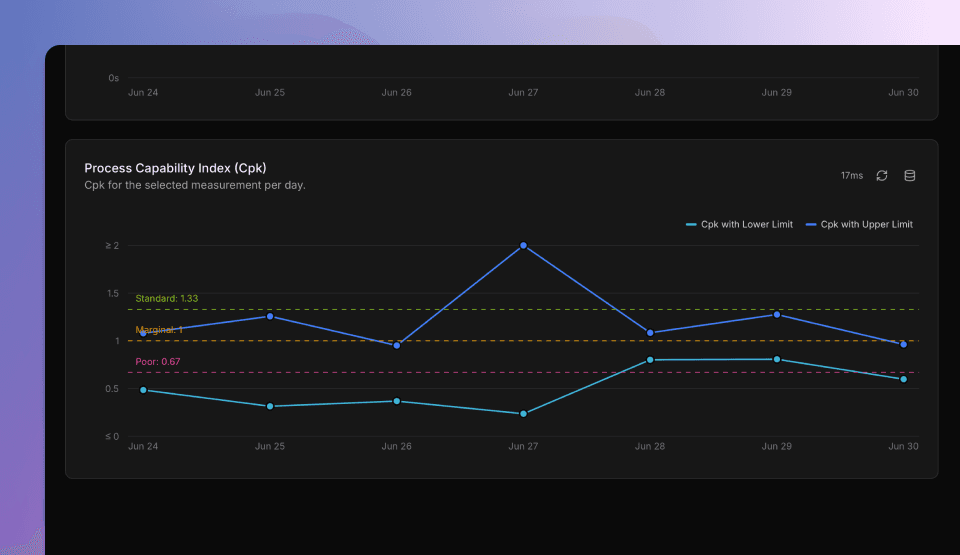
Process Capability Index (Cpk)
Cpk measures how consistently a test measurement stays within its limits. Applies to numeric measurements with at least one limit (lower or upper). TofuPilot calculates Cpk in real time for every numeric measurement of every Phase.
Use the Capability table to sort all Phases from highest to lowest Cpk. Select a specific measurement to see its daily Cpk evolution, calculated separately for lower and upper limits.
Formula and Interpretation
Cpk = min[(upper_limit - μ) / (3σ), (μ - lower_limit) / (3σ)]Where μ = Mean, σ = Standard deviation
- Cpk > 1.33: Process is well centered and stable
- Cpk ≈ 1.00: Process is marginal
- Cpk < 1.00: Process is not capable and improvements are needed
Low Cpk indicates your test is too variable or poorly centered. Can result from overly tight limits, measurement drift, or unstable instruments.
Improving Low Cpk
- Use the Capability table to identify weak Phases
- Check control charts for historical trends
- Apply filters by revision, batch number, or part to isolate root cause
- View Cpk variation over time for specific measurements (shown separately for lower and upper limits)
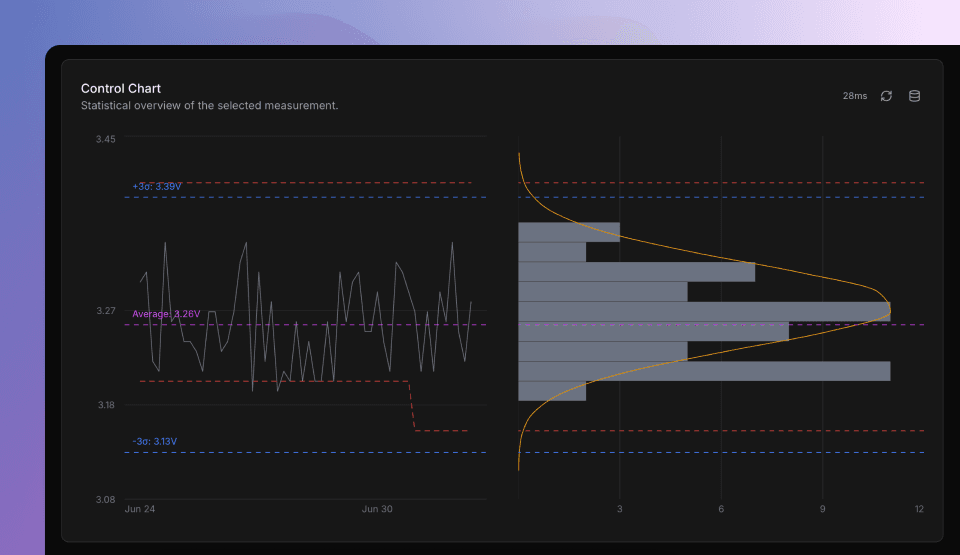
Control Charts
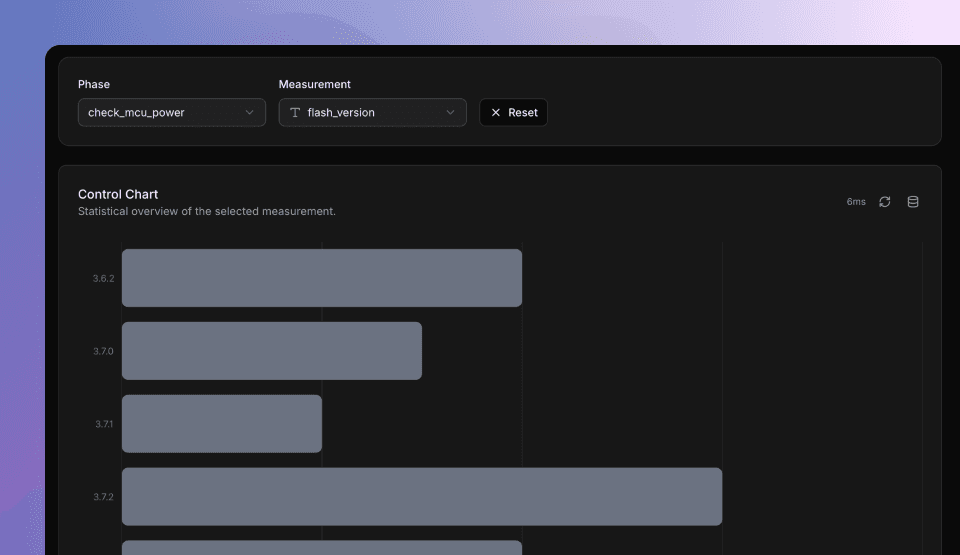
The Control Chart helps you monitor a selected phase’s measurement over time and detect drift, instability, or trends.
Control charts support numerical, boolean, and string measurement types.
Displays:
- All recorded values
- Lower and upper limits from your test script
- Average of recorded values in the selected date range
- ±6σ standard deviation
- A histogram with a Gaussian overlay
Measurement Types
Numerical: Values and limits pulled directly from your script. TofuPilot automatically computes average, standard deviation, and histogram based on selected data. If your script changes test limits over time, the chart reflects this with daily limit curve updates.
Boolean: Expected values displayed in green, unexpected values in pink.
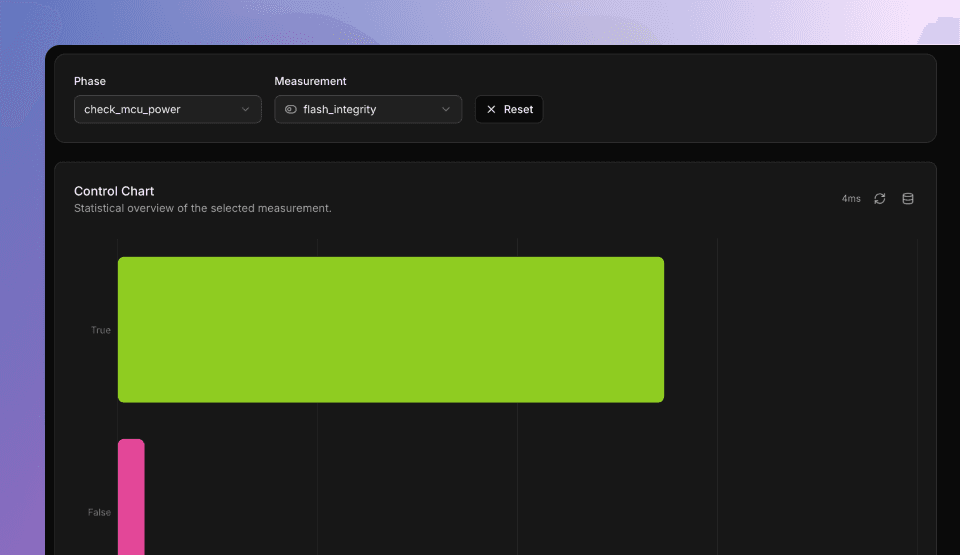
String: Expected values displayed in green, unexpected values in pink. If no validators exist, all values displayed in gray.
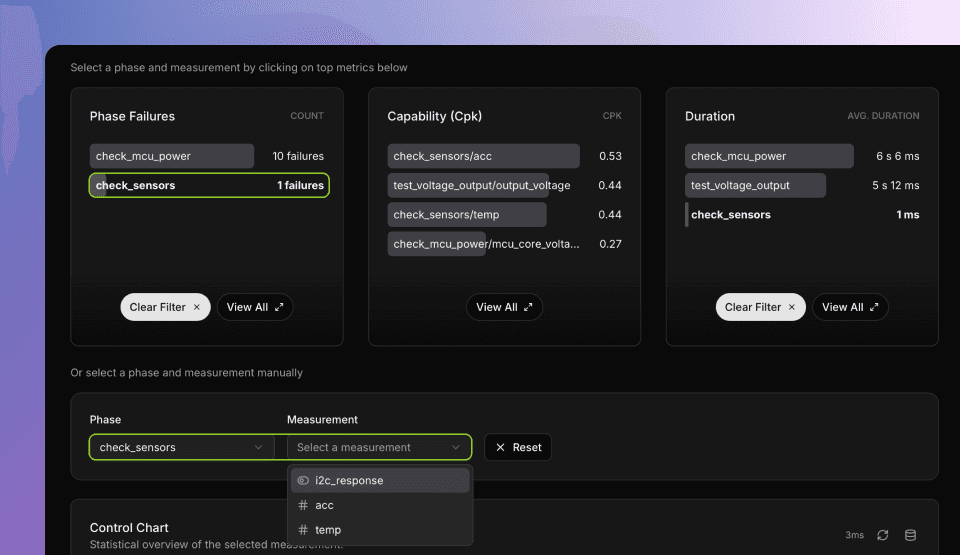
Phase Failures
Identify which test Phases fail most often.
The Phases Failure table lists all failing Phases, sorted by failure count. Phases that never failed are not shown.
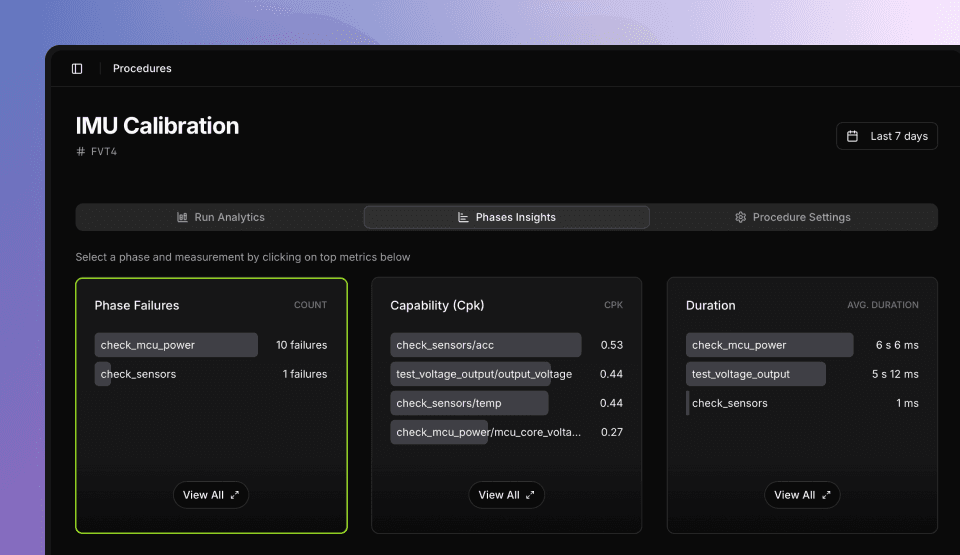
Phase Durations
The Duration table lists Phases by average duration (longest first). Identify bottlenecks in your Procedure.
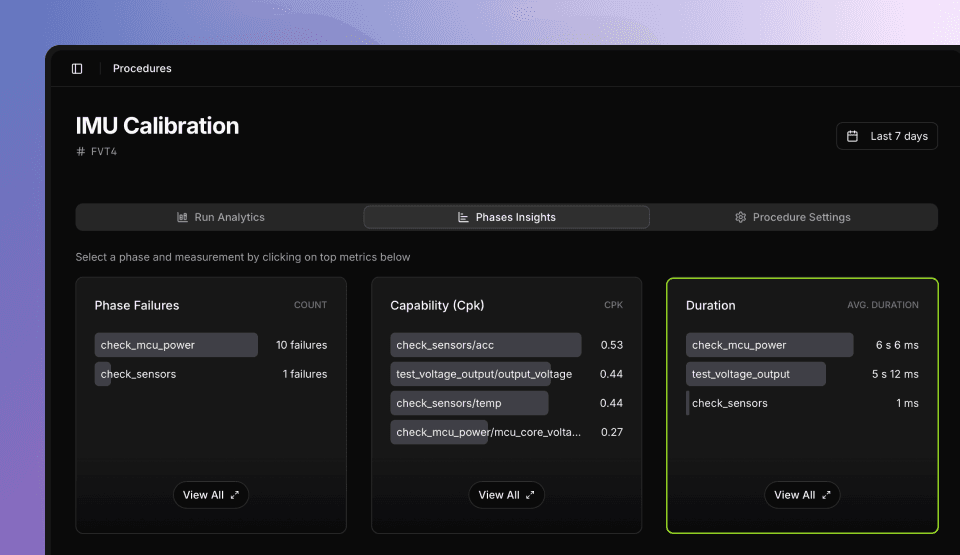
Select a specific Phase to see how its average duration evolves day by day in a dedicated chart.
Filter analytics
Filter analytics across Run and Phase views to narrow down root causes. Filters apply to all charts and tables. Reset all filters by clicking Clear Filter.
Filter Types:
- Date: Select specific day or date range (default: last 7 days)
- Metadata: Source (user/station), batch, Procedure version, part name/revision
- Phase-specific: Select specific Phase and measurement from tables or dropdown
Rename Procedures
Rename the Procedure or its procedure_id directly in the app.
Go to the Procedure page, then click Procedure Settings. Edit its Name and ID.
Deploy to Stations
Deploy procedure scripts to production stations via GitHub or GitLab integration. This enables version-controlled deployments where specific commits can be pushed to designated stations.
Prerequisites
- GitHub or GitLab: Install the TofuPilot GitHub App or connect your GitLab group from Settings > Organization
- Stations: Create at least one station
Link a Repository
Navigate to Procedure > Deployment tab.
Select a repository from the dropdown.
Link Repository.
Deploy Commits
Browse commits from the linked repository. Each commit shows one of three statuses:
- Ready — available to deploy
- Deployed — pushed to at least one station
- Deleted — the branch or commit was removed from the repository
Filter by branch, author, status, or date range, or use the search box to find a specific commit.
Click a commit to open the detail panel.
Select target stations using the checkboxes. Stations already deployed to that commit are pre-checked.
Click Deploy to N stations to push the commit.
TofuPilot Station
TofuPilot Station automatically syncs with your repository to deploy up-to-date procedures without downtime.
How is this guide?