API Activity
Monitor and track your API usage with real-time metrics and detailed request traces.
Overview
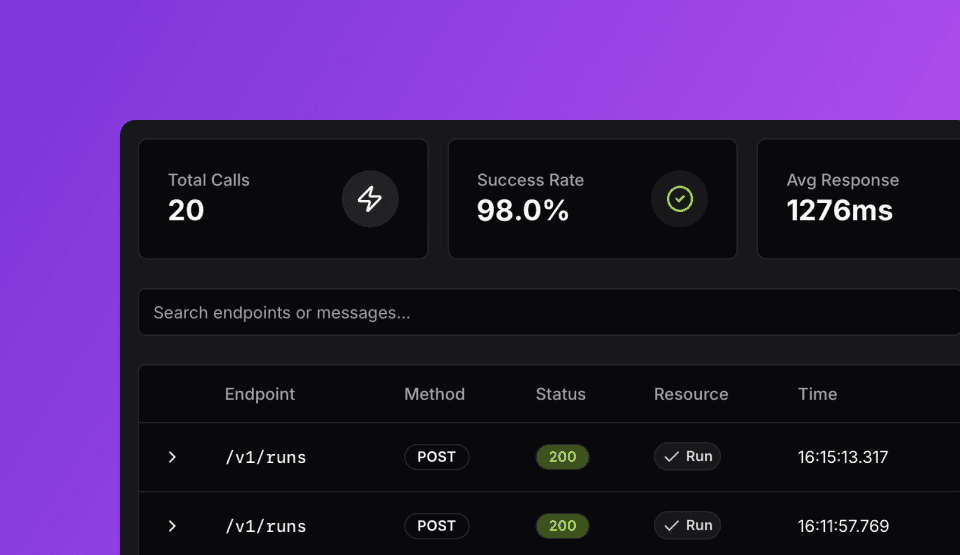
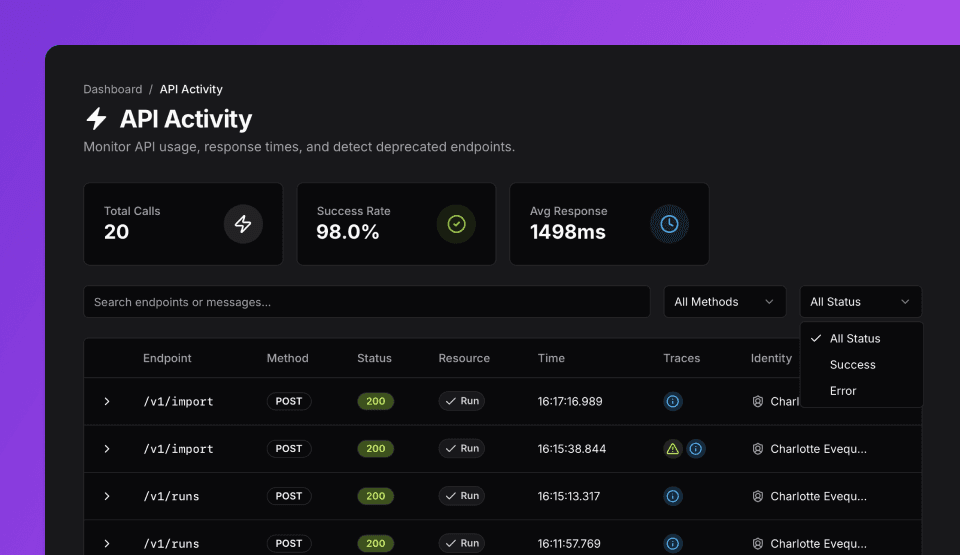
API Activity provides real-time monitoring of your TofuPilot API usage. Track request metrics, response times, and identify failed calls to optimize your integrations.
Monitor API Activity
Track API usage with real-time monitoring. View request metrics, response times, and identify failed calls.
View Key Metrics
Access API Activity from the navigation menu:
- Total Calls: Total API requests made
- Success Rate: Percentage of successful requests
- Avg Response: Average response time in milliseconds
- Deprecated: Count of deprecated API calls
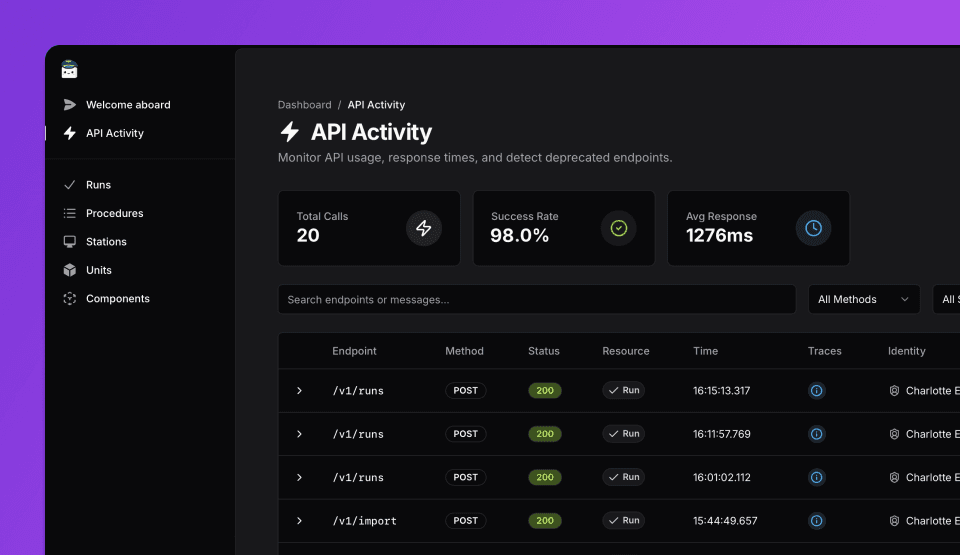
View Request List
Browse all API requests ordered by timestamp. Each request shows endpoint, method, status, and response time.
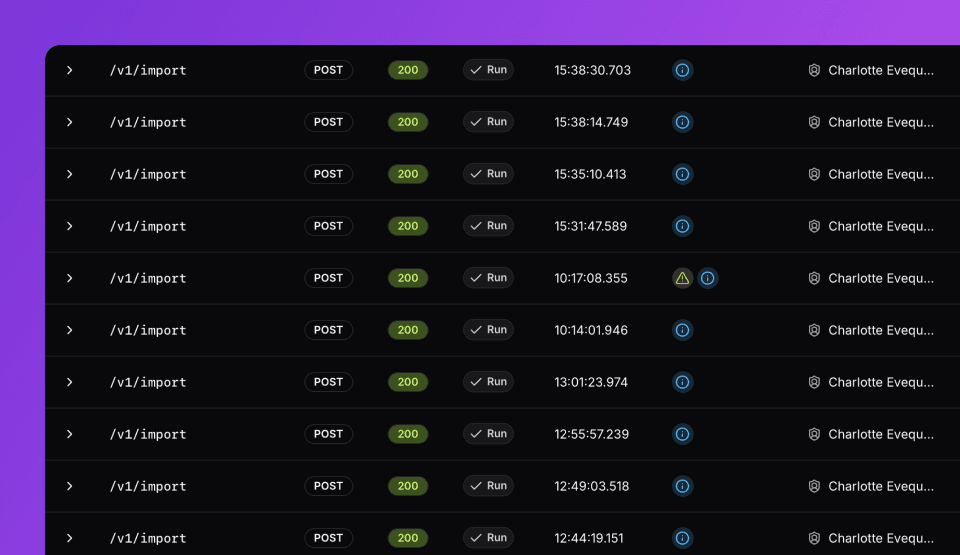
View Request Trace
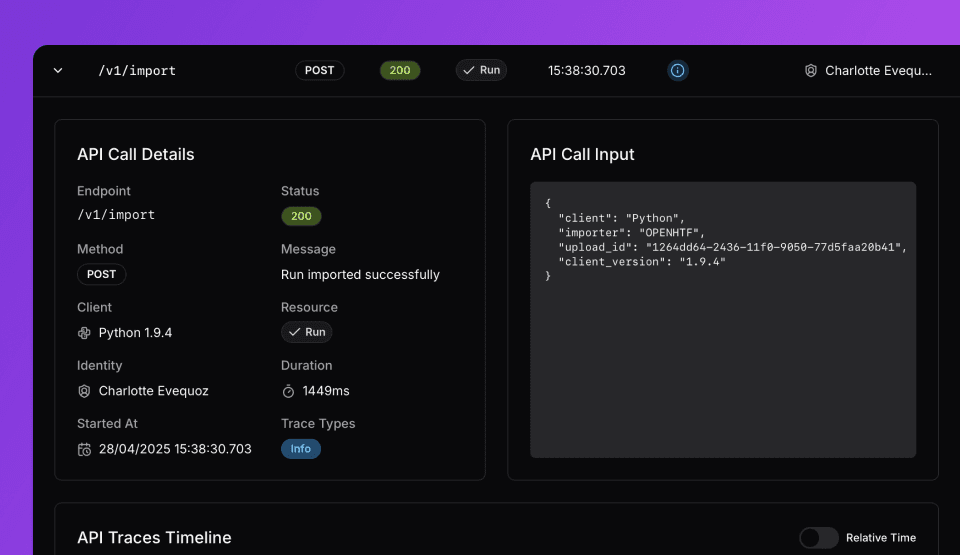
Click any request for detailed information:
- Payload: Complete request body
- Method: HTTP method and response status
- Timing: Start time and total duration
- Version: Client version used
- Trace: Request type and messages
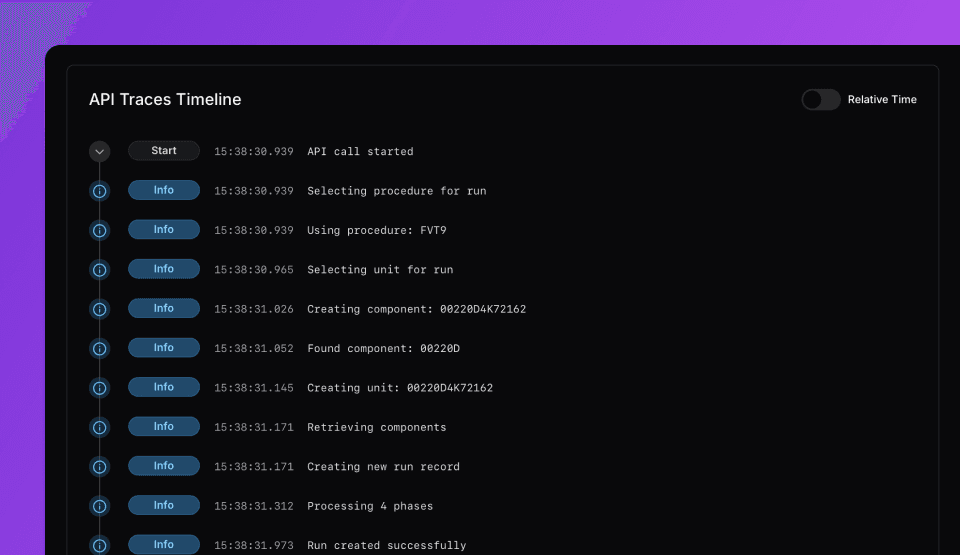
View Trace Timeline
Analyze internal processing steps with timing breakdown. Switch between absolute timestamps and relative timing from request start.
Filter Requests
Narrow results using filters:
- Search: Filter by endpoint path or message text
- Method: Show specific HTTP methods (
GET,POST,PUT,DELETE) - Status: Filter by success or error status
API Reference
For programmatic access to TofuPilot services, see our REST API v1.0 and REST API v2.0 documentation.
Install Client
Install the TofuPilot client for your environment:
pip install tofupilot openhtf sixpip install tofupilotRequired Parameters
All API requests require authentication:
- OpenHTF: Pass
api_keytoTofuPilotconstructor - Python: Pass
api_keytoTofuPilotClientconstructor - REST: Include
Authorization: Bearer <api_key>header
| Prop | Type | Default |
|---|---|---|
api_key? | str | – |
base_url? | str | https://api.tofupilot.com/v1 |
from tofupilot.openhtf import TofuPilot

with TofuPilot(test, api_key="your-api-key"):
  test.execute(lambda: "SN001")
from tofupilot import TofuPilotClient
client = TofuPilotClient(api_key="your-api-key")curl -H "Authorization: Bearer your-api-key" \
https://api.tofupilot.com/v1/runsHow is this guide?
Remove station DELETE
Remove a station with smart deletion behavior. If no runs exist, permanently deletes the station and all nested elements. If runs exist, archives the station (soft delete) and unlinks all procedure relationships but preserves historical data.
Self-hosting
Deploy TofuPilot on your own infrastructure.